This week, I am trying to determine the answer to a major debate among sports fans: "What is the most miserable team (and city) in all of sports?" ESPN published its own "Sports Misery Index" in 2019, but a lot has changed in the sports world since then, so I have created my own "Sports Pain Index" (SPI) to fill the void. To do this, I looked up four major draughts for all 124 major North American professional sports teams: how many years it has been since their last playoff appearance, how many years it has been since they last advanced in the playoffs, how many years it has been since they last made the finals of their league, and how many years it has been since they last won their league championship (or how many years they have been around if they have never won a championship). I then put all of these results into a Numbers table and weighted them equally. By adding up each of the four adjusted draught lengths, I was able to compute the SPI for each team. Teams that have just won championships will have SPI's of 0, while the average SPI across all 124 teams is 52.04. My full results can be found here , but the worst 10 teams are as follows:
The Maple Leafs are the most miserable team that still managed to make the playoffs in 2022. They haven't even played in the Stanley Cup Finals since winning all the way back in 1967.
The Orioles haven't played in the playoffs since Buck Showalter put in Ubaldo Jimenez over Zack Britton in 2016. Their last World Series appearance was their win in 1983.
Despite having quite probably the two best players of their generation on their roster, the Angels haven't made the playoffs since 2014 and haven't won a playoff series since 2009. However, the Angels did at least win a World Series relatively recently, doing so in 2002.
Although they recently made the playoffs due to 2020's expanded format, the Reds haven't won a playoff series since sweeping the Dodgers in the 1995 NLDS.
The most miserable MLB team, the Pirates haven't made the playoffs since getting shut out by Jake Arrieta in 2015. They also haven't made the World Series since winning in 1979.
Although they are not typically thought of as a "cursed" franchise, the Hornets haven't won a playoff series since 2002, a span that includes two years in which the franchise was inactive. They've only won a total of three playoff games across three appearances since resuming operations in 2004.
The most miserable NHL team, the Sabres own one of the three double-digit playoff draughts in major North American professional sports, last making the final 16 in 2011. However, they're currently neck-and-neck with the Capitals for the final wild-card spot, so they could come off this list in the near future.
The Jets own the second of the three double-digit playoff draughts, last making it in 2010, two years before the Buttfumble. The Jets also have yet to return to the Super Bowl since Joe Namath led them to the title in 1968. But maybe they'll get Tom Brady next season?
The Lions haven't won a playoff game since 1991, the longest draught in major North American professional sports. They also haven't made a single Super Bowl, and last played for the NFL championship in 1957. Even worse, the Lions seem destined to rise to the top of this list in the very near future.
That's because the most pathetic team in all of professional sports, the Sacramento Kings, is somehow currently sitting in third in the West and seems likely to end its sixteen-year playoff draught. Considerably less likely, however, is the prospect of the Kings ending their 71-year NBA finals appearance drought, which is also the longest in major North American professional sports.
For the second half of my project, I used R to calculate the most miserable sports cities in North America (the 31 cities with at least two teams in the four major sports leagues). There are two main ways to do this. First, I found the average SPI for the teams in each city. By this method, the five most miserable sports cities in America are:
Interestingly, three of these five cities are in the Midwest.
And the five least miserable:
It should come as no surprise that Boston and Philadelphia, the two most hated sports cities in the U.S, have experienced a lot of success in recent years.
However, this isn't really what people think of when they think of cursed sports cities. Last but not least, I used the same formula as I did for individual teams to calculate an overall SPI value for each of the 31 sports cities. Houston, Denver, and San Francisco (cities who had championship teams in 2022) had values of 0, as fans in those cities experienced a playoff berth, playoff advancement, finals berth, and championship in 2022 from the Astros, Avalanche, and Warriors respectively. At the other end of the list are five Midwestern or Midwestern-adjacent cities:
A two-team sports city, Nashville has experienced some success recently with deep playoff runs from both the Predators and Titans. However, neither Nashville team has ever won a championship in their history.
The first of two four-team cities on this list, it has been no less than 31 years since a Minnesota team last played for its league championship, although the state does get a slight drop in its SPI because the Wild have only been around for 22 of those years.
Neither the Bills nor Sabres have won a championship in their combined 109 years of existence. However, with the recent (mostly regular-season at this point) success of the Bills, Buffalo could be on its way off this list.
The Colts have carried Indianapolis, as the Pacers haven't done much of anything in their 46 years of existence outside of their trip to the 2000 NBA finals.
Way below (or above) everyone else can be found Detroit, the undisputed most miserable sports city in North America. Despite having four teams, Detroit hasn't seen a playoff game since the Pistons were swept in the first round in 2019 and hasn't seen a playoff series win since the Tigers won the 2013 ALDS. Detroit has, however, seen three championships since 2000 (the Red Wings in 2002 and 2008 and the Pistons in 2004), so most Detroit residents at least have memories of a time when things weren't so bad. It will almost certainly be a while before they get back to that level, though.
This week, I am focusing on a much more serious topic than those I have previously covered: crime. Obviously, crime is a major problem in cities throughout the United States, including in my home city of Chicago. While a lot has been written about the major societal factors (poverty, level of education, possession of weapons, etc.) and their impact on the crime rate in certain areas, I decided to explore a potential hidden factor that also could influence the crime rate: the temperature. On one hand, when there are warmer temperatures, there are usually more people, both criminals and victims, out and about, which would likely lead to more crime. On the other hand, when temperatures are colder, it is often harder for lower-income people to find food and shelter, which could motivate them to commit criminal acts out of desperation and increase the crime rate. There are also many other potential factors, including the direct psychological impact of the heat/cold itself, that could influence this relationship.
To explore this relationship, I used two major datasets. First, I went to the City of Chicago's crime data set to find the number of crimes committed on each date from January 1, 2017 to December 31, 2019 (The 2022 dataset has not been finalized yet, and the 2020 and 2021 datasets would be strongly influenced by the pandemic). This data set gives information about 798,916 crimes that occurred in Chicago during the three-year time period. Second, I used Weather Underground's historical database to find the high temperature in Chicago on each of those 1,095 days, and combined the two datasets into one using R. My data set gives both the number of crimes (n) that occurred on each date between January 1, 2017 and December 31, 2019, and the temperature on that date. Notably, there seemed to be an unusually high number of crimes on the first of each month (probably a back-log from the previous month), so I removed those 36 dates from the analysis, giving me a total of 1,059 dates/temperatures and 766,786 crimes, with about 724 crimes occurring per day on average. For those curious, the date with the most criminal activity was August 5, 2017 with 928 crimes (closely followed by August 4, 2017, with 924 crimes), while the date with the least criminal activity (by a mile) was January 30, 2019, on which 341 crimes occurred. The warmest date was a four-way tie at 96 degrees Fahrenheit, while the coldest date, again by a mile, was none other than January 30, 2019, on which the high was -10.
Running a basic linear regression between temperature and crime gave me a very stunning result: No less than 56% of the variance in crime rate can be explained by variance in temperature. For each degree warmer the temperature gets, 2.82 more crimes occur in Chicago, with a standard error of only 0.08. Obviously, rather than arresting criminals, the government should just send them all to Alaska and the problem of crime will be solved. Easy!
Unfortunately, things are not as they seem. Clearly, there is much more crime in the summer than in the winter. However, the increase in crime rate could be due to characteristics of the summer (for example, school being out) that are not directly influenced by temperature. So, I filtered the data to include only the "peak of summer" (June 13 - Sept. 2), and then only the "dead of winter" (December 17 - February 16, excluding Christmas when crime is unnaturally low). During each of those date ranges, Chicago's average temperature on each date, according to weather.gov, is within 5 degrees of the warmest/coldest average date of the year. My results were as follows:
In the summer, while temperature still seems to have a significant impact on the crime rate, accounting for 9.83% of the variation in crime rate, the impact is nowhere near the huge 56% seen when the entire year is looked at. In the winter, however, the slope of the line of best fit is almost twice as much as in the summer, and the R-squared value is 43.14%. This means that during the winter months, almost one-half of the change in crime rate can be explained by the change in temperature! Could this really be true? Importantly, when the 15 coldest days (days where the high temperature is below 15 degrees) are removed, the slope drops to 3.33 and the R-squared drops to 28.03%. What these results seem to suggest is that the relationship between temperature and crime is not linear: The colder the temperature gets, the steeper the slope, and the faster crime drops.
While the exact magnitude of this impact seems to vary, one thing is clear: temperature is a major contributing factor in the level of crime in Chicago. Next, I want to explore this impact further. First, if warmer temperatures really do increase the crime rate, domestic crime should not be affected on warmer days, and might even decrease with more people out and about. Thus, I filtered the dataset to include only domestic crimes. Interestingly, as it turns out, the relationship is still extremely significant. The entire-year R-squared value is 27.36% (about half of the 56% for all crimes), and the summer-only R-squared value is 8.5% (only a little bit smaller than the 9.8% for all crimes). Perhaps the increased crime of warmer days trickles over into domestic life.
Lastly, I only looked at crimes that resulted in an arrest, which made up about 20% of all crimes. For these crimes, the effect of temperature was much less significant. For the winter, the R-squared value dropped by half, from 43% to 21% (which fell even further to 7.8% when only days with high temperatures above 15 degrees were included, and to 3.6% with a p-value of 0.02 when only days with high temperatures above 20 degrees were included). In the summer, the R-squared value was only 1.7%, and the p-value of the linear regression was 0.04. This suggests that although the number of arrests is not affected very much by temperature, a much higher percentage of crimes end in an arrest on colder days than on warmer days Determining the reason for this is outside the scope of this project, but one hypothesis is that cops can only arrest so many people in a day, and the larger number of crimes on warmer days means that many more crimes go unpunished on warmer days than on colder days. Another hypothesis is that crimes committed on colder days are more serious than those committed on warmer days. Further research is necessary to tell for sure.
In conclusion, warmer temperatures are a major factor in increasing crime rates, and the effect is much stronger in the winter than in the summer (although still very strong in the summer). This relationship is true even for domestic crime. However, the number of arrests made does not change much with temperature, the reason for which is unknown. Lastly, I have some potential hypotheses for the reasoning behind my main result, that crime increases with warmer temperatures. Most likely, warmer temperatures simply mean that more people are out and about, including both criminals and victims (this is supported by the fact that there is a much smaller positive effect of temperature on crime on days with temperatures above 85, when people might not be as motivated to go outside as it becomes unbearably hot), meaning there are more social interactions and therefore more crime. Additionally, criminals might feel more energetic and more willing to commit crimes on warmer days, and warmer weather also could lure victims into a false sense of security. As it turns out, maybe we should just ship all the bad guys off to Alaska!
For this week's project, I turned to another one of my major interests: music. I enjoy listening to many different kinds of music, and I wanted to explore some of the characteristics of successful songs and artists in the current era of music. To do this, I looked at the Billboard Year-End Hot 100 for 2022, which is a well-known ranking of the top 100 songs of last year in the United States, from the Glass Animals' "Heat Waves" at #1 to Maren Morris' "Circles Around This Town" at #100. Of the 100 songs, only 5 had groups as their lead artist (Glass Animals, OneRepublic, Silk Sonic, and Parmalee were the four lucky bands, as well as the cast of Encanto), 3 had some combination of a group and one or more individuals as their lead artists, 17 had multiple individuals as their lead artists, and the remaining 75 songs had one individual as their lead artist. 12 of the 100 songs had one or more featured artists. Additionally, 61 of the 100 songs were by men or all-male groups, 30 were by women (there were no all-female groups in the Hot 100), and the other 9 were by mixed-sex pairs/groups of artists.
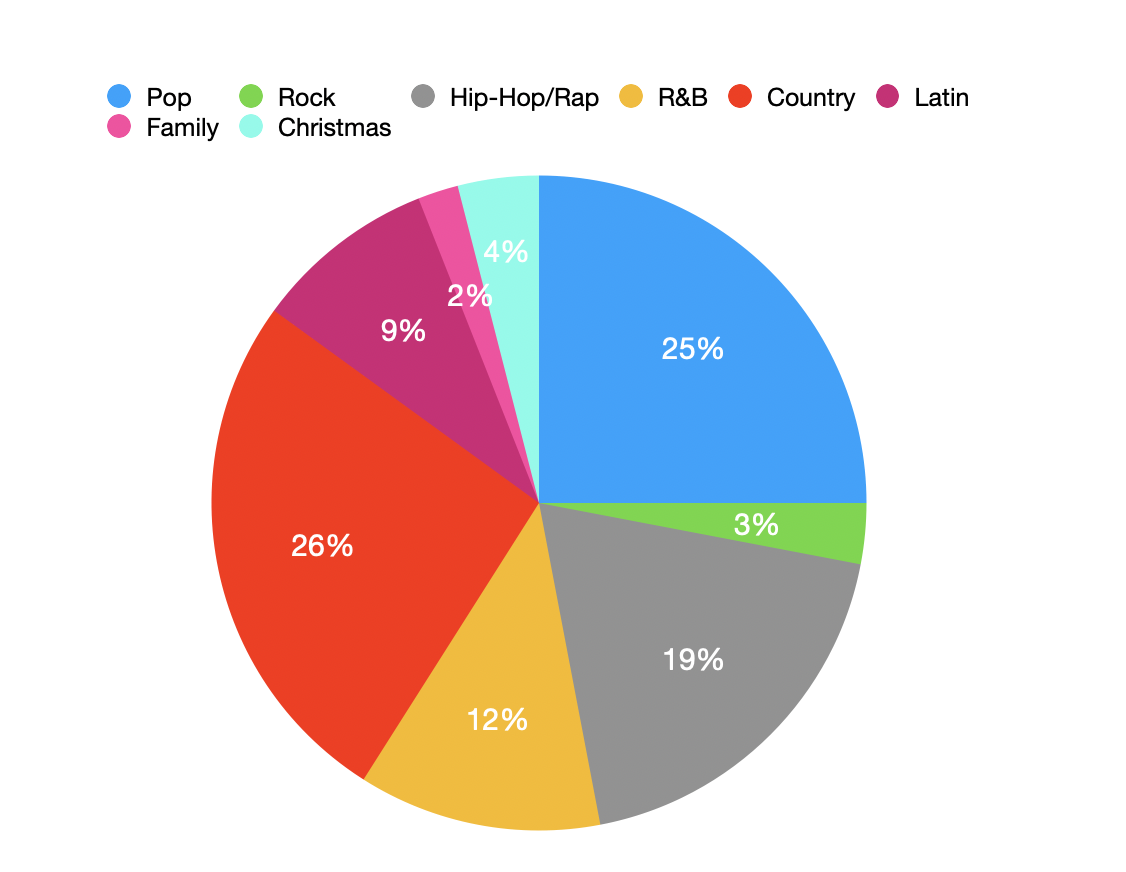
The last thing I did before I began my official analysis was to classify each song to a genre. This is admittedly a very subjective process, and for the sake of simplicity, I used my own personal opinion to classify each song. The result was four main genres of music popular in the US in 2022: Country (26 songs, led by Morgan Wallen who was the lead artist on three songs and featured in two more), Pop (25 songs, led by Dua Lipa who was the lead artist on three songs), Hip-Hop/Rap (19 songs, led by Doja Cat who was the lead artist on four songs), and R&B (12 songs, led by Adele and the Weeknd who were lead artists on two songs each). I grouped the remaining songs into four smaller categories: Latin (9 songs, every single one of which was by either Bad Bunny or Karol G), Christmas (4 songs), Rock (3 songs), and Family (2 songs, both from Encanto).
In chart form:

Unfortunately, some issues loomed. For one, despite having the most songs on the chart of any genre with 26, country music had only two songs in the top 30, while rock music, despite holding only 3 spots on the chart, had the #1 song of 2022, "Heat Waves." Simply counting the number of appearances of certain songs on the chart does not give the full picture. To fix this problem, I decided to weight each song by its position on the chart. Each song's "point value" was calculated by dividing 100 by its position: the #1 song was worth 100/1 = 100 points, the #2 song was worth 100/2 = 50 points, the #10 song was worth 100/10 = 10 points, the #50 song was worth 100/50 = 2 points, and the #100 song was worth 100/100 = 1 point, for example. While this is admittedly not a perfect method (for one, it greatly exaggerates the value of the #1 song, which is worth ten times as much as the #10 song), this is the best method of weighting for overall song performance that does not involve greatly increasing the complicatedness of this project (simply reversing the songs' positions would mean that the #99 song (2 points) is weighted twice as much as the #100 song (1 point), while the #1 song (100 points) is essentially weighted the same as the #2 song (99 points)). After carrying out this analysis, the rankings of songs by genre went like this:
And in chart form:
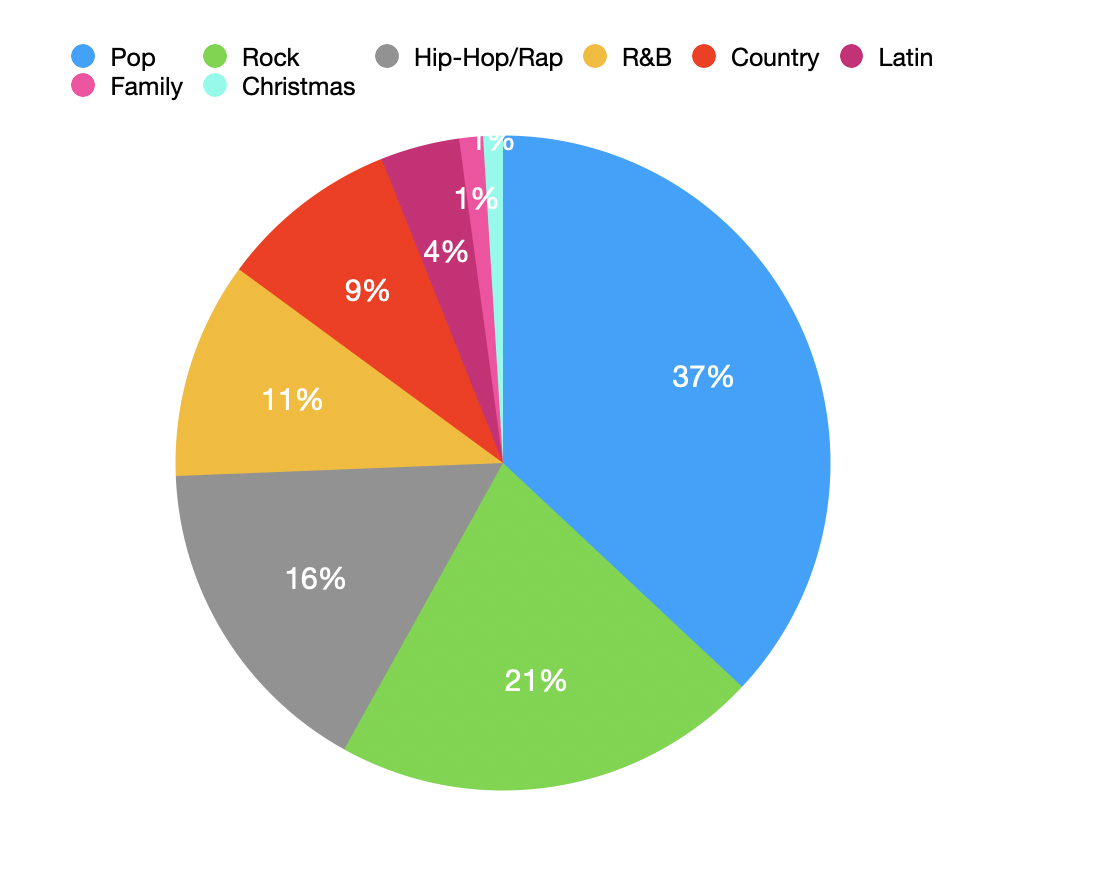
As it turns out, pop music is the clear king of music in the US in 2022, while country music and rock are not quite as popular as they seem if you only look at one of the lists. Hip-Hop/Rap is probably the second-most popular genre of music in the US despite finishing third on both lists. Looking at the weighted breakdown by sex showed an even stronger advantage for male artists, who scored 4/5 of the points despite having only 2/3 of the Hot 100 songs:
This difference can be explained by the fact that the very highly-weighted #1 and #2 songs were both by male artists (the Glass Animals and Harry Styles). Going further, I broke down each of the four major genres of music by sex:
Pop:
Hip-Hop/Rap:
R&B:
Country:
Surprising absolutely nobody, country music is dominated by male artists, as only three songs with a female lead artist placed in the Hot 100 (and they were #76, #92, and #100). R&B, on the other hand, is the most gender-balanced of the four major genres. Despite being definitely favored towards male artists, rap and hip-hop are more gender-balanced than a lot of people might think, in large part due to the success of Doja Cat who has four of the seven female hip-hop/rap songs on the chart. The most interesting result, however, is that of pop music. Although it is the only genre in which more songs by women appeared on the chart than songs by men, pop songs by men placed far higher (including "As It Was" by Harry Styles at #2 and "Stay" by the Kid LAROI and Justin Bieber at #3, as well the #5 and #8 songs) than pop songs by women (the highest of which was Lizzo's "About Damn Time" at #12). Could this be just a strange coincidence, or a broader trend? This research is not deep enough to answer that question, although looking at the 2021 Hot 100 (in which female pop songs placed at #1, #5, #6, and #8, and the only male pop song in the top 10 was #9) suggests that the higher placings of male songs is just a coincidence.
But what about the broader question: why do male artists perform so much better than female artists overall, especially when singing is often stereotypically thought of as a female activity? While it is beyond the scope of this project to come up with a definitive hypothesis, I have two ideas. One is that, as males are often seen as more favorable to risk-taking and attention-seeking than females, the success of male artists comes from a higher willingness to embrace the spotlight of life as a mega-celebrity. This in turn results in the stereotype that "ambition is only for men," discouraging female singers from pursuing celebrity status and further decreasing their representation on the Hot 100 chart. My second hypothesis also centers around stereotypes: while it is considered acceptable for women and girls to listen to music by male artists, men and boys who listen to music by female artists are often ridiculed and seen as "weak" and "unmasculine." Because half of the population is discouraged from listening to their music, female artists would be expected to be less successful than male artists. Whatever the reason, the high levels of success of male artists as compared to female artists is something that should be analyzed further.
The last thing I wanted to look at was the average age of artists in various genres. To do this, I removed the five "old songs" that re-appeared on the Hot 100 in 2022 ("Running Up That Hill" by Kate Bush and four Christmas songs), as well as the 10 or so songs whose artists' ages are not listed on famousbirthdays.com and the 8 songs that included a musical group as a lead artist. For each artist, I used their age on January 5, 2023 according to famousbirthdays.com as their official "age". The skew caused by using the artists' current ages instead of their ages when their songs came out in 2022 should be mostly cancelled out by the fact that age is always rounded down, meaning that someone listed as being 26 years old could actually be 26.5 or 26.9 years old, but never younger than 26. The average ages were as follows:
There are no huge surprises here. Pop music has a younger following, and therefore has the youngest artists. Country music, on the other hand, has an older following and older artists, although the gap (6 years) between average ages is not as big as you might think. Male artists are slightly older than female artists on average, with an age gap of 3 years, while the overall "peak age" of a musical artist seems to be about 30, similar to the "prime" of a professional athlete. In music, as in many other aspects of life, it is the young people who rule the world.