This week, I am looking at how U.S. states voted in recent presidential elections, and seeing how certain states can be grouped together. To do this, I gathered the results from each of the past five presidential elections (2004 through 2020), and found the Democratic candidate's margin of victory in each state in each election (a negative margin means the Republican won that state). Most states had values between 30 (the Democrat won by 30 percentage points) and -30 (the Republican won by 30 percentage points). I then used Excel Solver to try and group the data into four clusters based on their average voting patterns. However, this did not produce great results. The District of Columbia, in which the vast majority of people vote for the Democratic candidate, took up one cluster all by itself, and the other three clusters still seemed too big, with lots of differently-voting states all lumped together. Next, I decided to expand my search to seven clusters (six plus the District of Columbia). While one of the other clusters contained no states and made no sense, the remaining five clusters seemed to be accurate groupings of states that have voted similarly across the past 20 years. Without further ado, here are the clusters and cluster centers:
Cluster 1/2: District of Columbia
2004- Kerry +79.77%
2008- Obama +86.75%
2012- Obama +83.49%
2016- Clinton +86.34%
2020- Biden +86.52%
Some states have very exciting presidential races. The District of Columbia is not one of them and probably won't be in our lifetime.
Cluster 1: The Swing States
2004- Kerry +0.43%
2008- Obama +10.89%
2012- Obama +6.16%
2016- Trump +0.19%
2020- Biden +2.48%
These states, however, are the ones that decide presidential elections. With the exception of 2008 and 2012, when they supported Barack Obama by 11% and 6%, these states have seen razor-thin vote after razor-thin vote. If this cluster center was a state, it would have voted for the winner in every year except 2004.
States: Nevada, Colorado, New Mexico, Minnesota, Iowa, Wisconsin, Michigan, Ohio, Pennsylvania, Virginia, Florida, New Hampshire, Maine (2nd district)
Cluster 2: The Democratic Powerhouses
2004- Kerry +17.04%
2008- Obama +28.06%
2012- Obama +27.34%
2016- Clinton +24.78%
2020- Biden +29.29%
These states are known for being the most progressive in the country, and seem to be getting even more liberal. Any Democratic candidate can count on winning these seven states.
States: Hawaii, California, New York, Vermont, Massachusetts, Rhode Island, Maryland
Cluster 3: Leaning Republican-But For How Long?
2004- Bush +17.03%
2008- McCain +5.29%
2012- Romney +9.72%
2016- Trump +11.46%
2020- Trump +6.99%
This could be the most interesting cluster of states in the US. Although they have a history of voting Republican, many of these ten states and one district are gradually becoming less conservative over time and could be the swing states of the future. The fact that Arizona and Georgia voted for Biden in 2020 suggests that the shift is already happening to some extent.
States: Alaska, Montana, Arizona, Texas, Nebraska (2nd), Missouri, Mississippi, Indiana, Georgia, South Carolina, North Carolina
Cluster 4: Republican Powerhouses
2004- Bush +23.67%
2008- McCain +17.49%
2012- Romney +23.52%
2016- Trump +28.18%
2020- Trump +25.17%
These states are known for being the most conservative in the United States. Even in 2008, an election Obama won by 7.27% in the national popular vote, these states voted for John McCain by margins of around 17%. Any Republican candidate can count on winning these fourteen states and two districts.
States: Idaho, Utah, Wyoming, North Dakota, South Dakota, Nebraska (at-large, 1st, 3rd), Kansas, Oklahoma, Arkansas, Louisiana, Alabama, Tennessee, Kentucky, West Virginia
Cluster 5: Leaning Democrat
2004- Kerry +8.45%
2008- Obama +20.05%
2012- Obama +16.62%
2016- Clinton +13.52%
2020- Biden +18.16%
While these seven states and one district aren't as one-sided as those in Cluster 2, they still have voted for the Democratic candidate by double-digit margins in every election since 2008 and are unlikely to flip anytime soon.
States: Washington, Oregon, Illinois, Delaware, New Jersey, Connecticut, Maine (at-large, 1st)
This looks a lot cooler in map form:
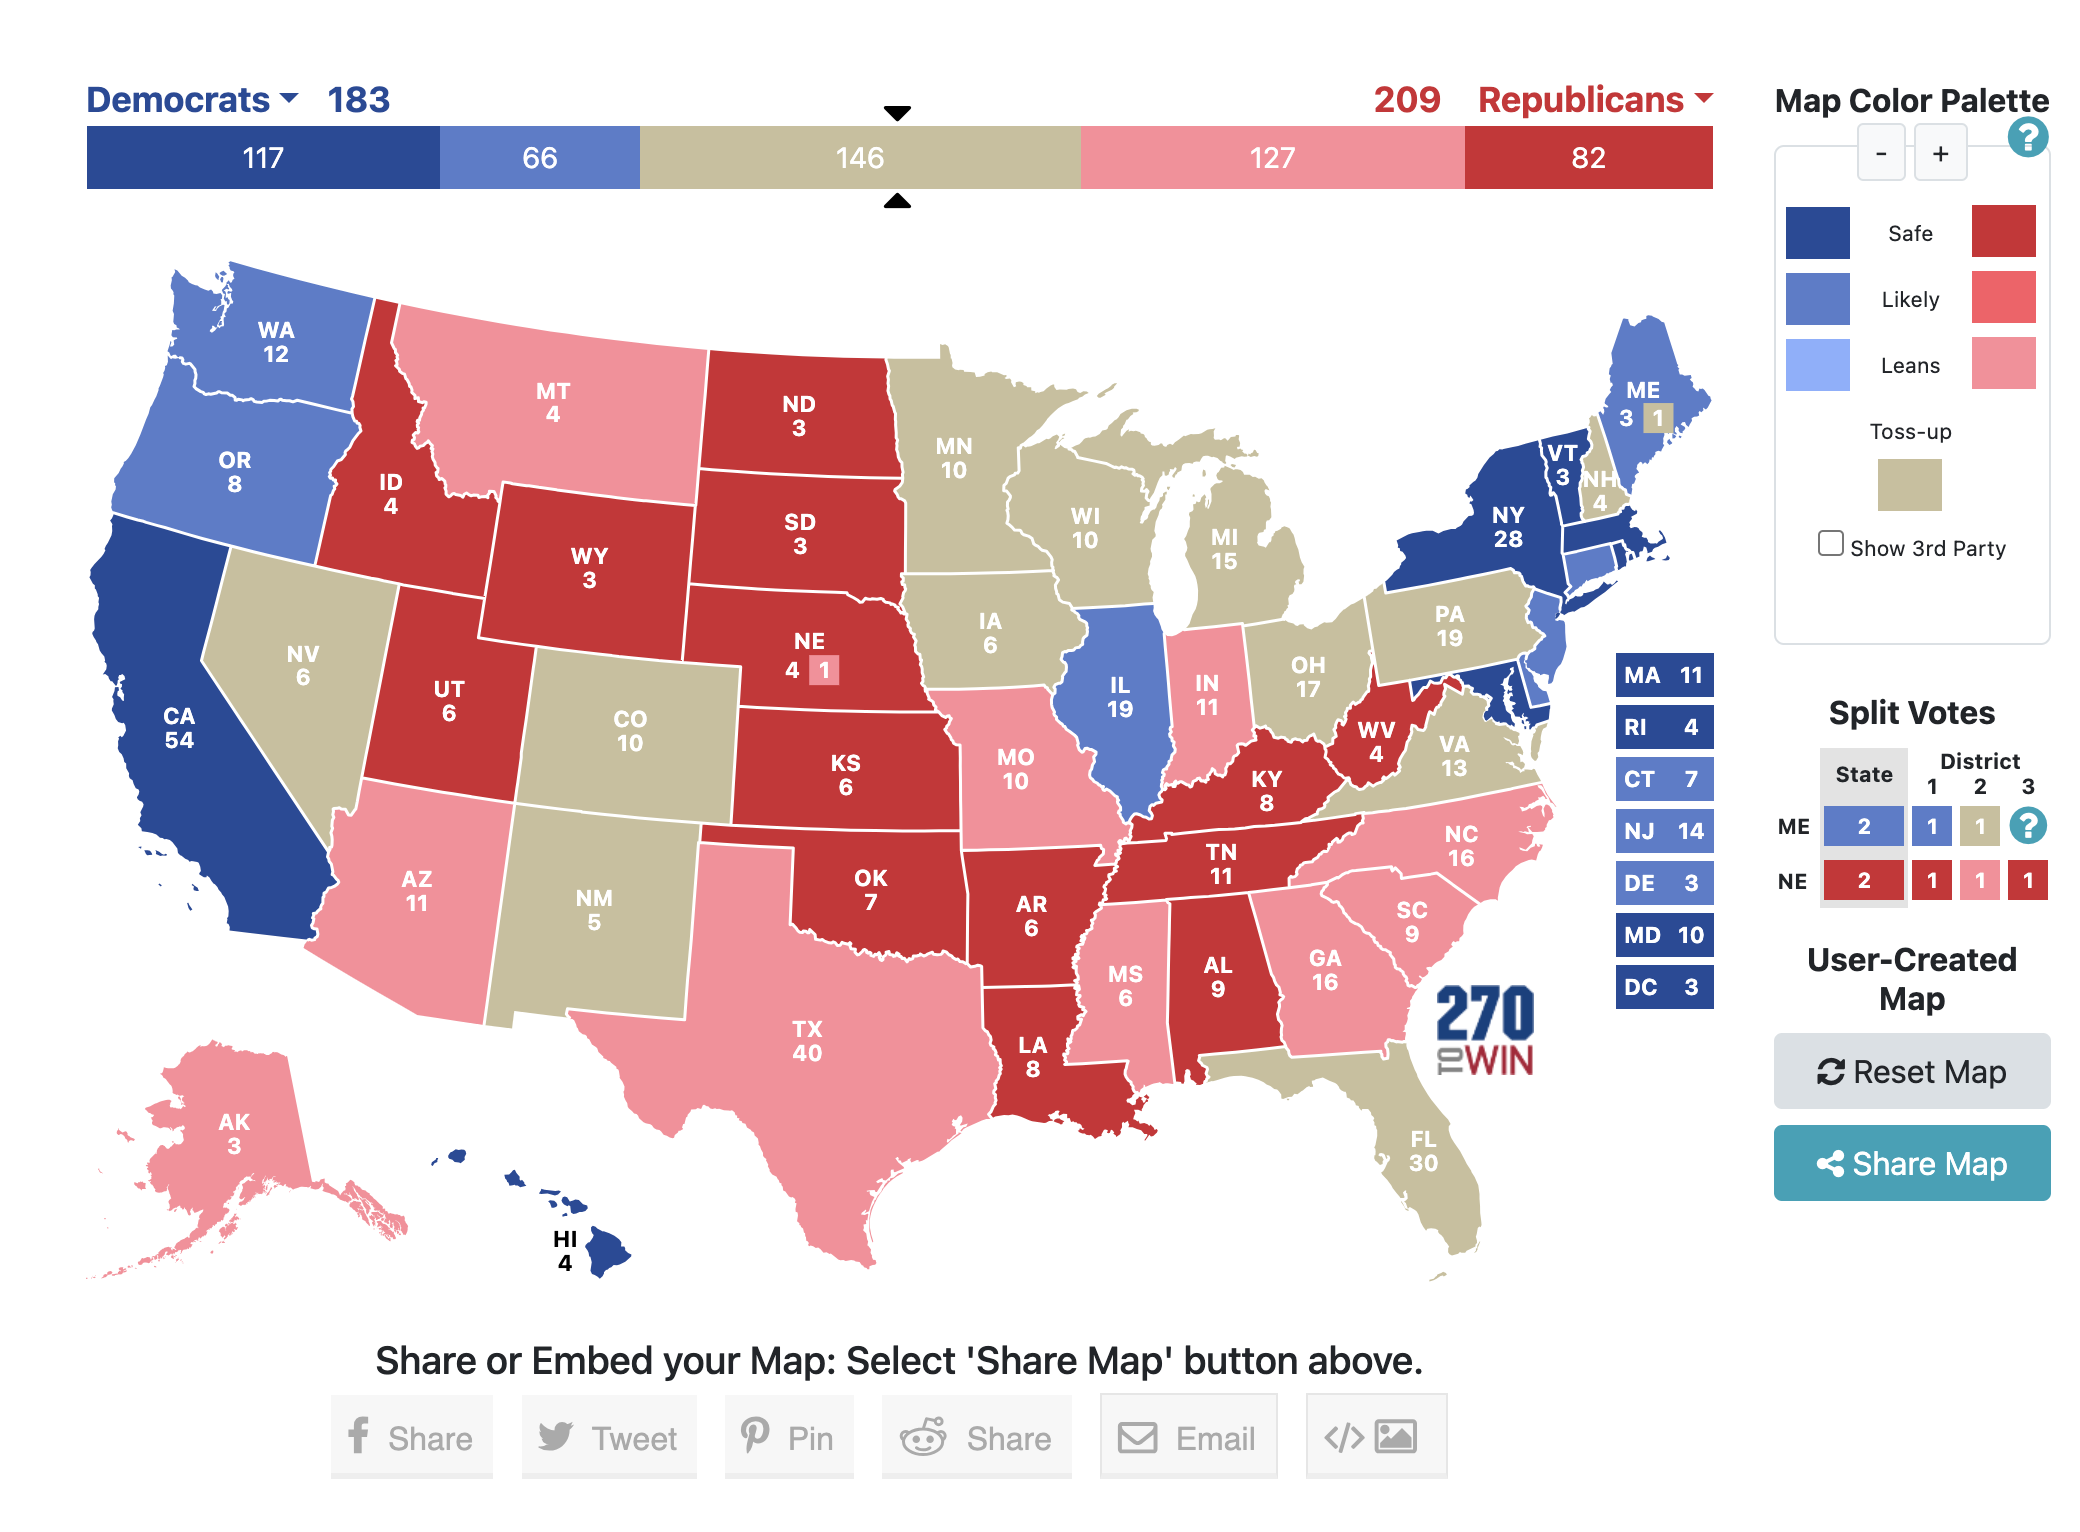
Red means Republican states, tan means swing states, and blue means Democrat states. What is really fascinating about this map is the fact that you can actually see how party strength changes with geography, something that is not as apparent on basic two-color maps. The strongest Republican states are in the central US. Surrounding them are the leaning-Republican states, including a significant part of the southeastern U.S. After that are the swing states, many of which are in the Midwest and Mountain West. Finally, there are the leaning-Democrat and strong-Democrat states, concentrated on the West and East coasts (except for my home state of Illinois). Very rarely do red and blue states actually border each other, and the only border between a strong Republican state and a strong Democrat state is between West Virginia and Maryland.
That's all for this week, but I hope you come back next Friday because I have some more great ideas planned for my future blog posts! If you want to look even more at states' voting patterns, I have linked my data, which includes calculations of the political distance between every possible pair of two states as well as silhouette calculations for the six clusters. See you soon!